




Come visit us at NRF2023 Jacob K. Javits Convention Center | New York City

Read More

How to Keep Solutions Affordable for Global Buyers?

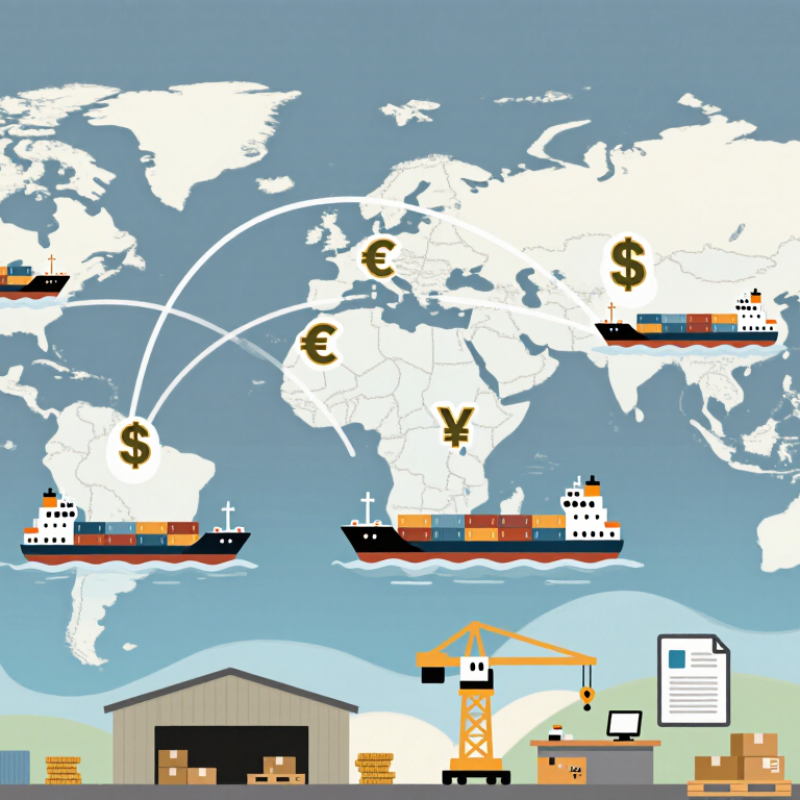
Keeping solutions affordable for global buyers is no longer a simple pricing exercise. Freight, currency movements, tariffs, payment fees, and service delays can quickly change the final invoice. UNCTAD reports that more than 80% of global merchandise trade moves by sea, making route selection and shipping reliability critical cost factors. A product may leave a factory at a competitive price, yet arrive with expensive storage charges or customs delays.

The World Bank’s Logistics Performance Index 2023 shows that supply-chain reliability remains uneven across markets. Buyers therefore judge value through the complete ownership cost, not only the quoted unit price. This is where suppliers must keep solutions practical: offer modular packages, publish landed-cost assumptions, and provide local support where possible. The WTO’s Global Trade Outlook and Statistics 2024 projected merchandise trade growth of 2.6% in 2024 and 3.3% in 2025, suggesting continued cross-border demand, but not uniform purchasing power. Currency risk remains real.

Small details matter.

A supplier with experience should compare container sizes, minimum order quantities, warranty exposure, and replacement-part availability before promising savings. Transparent pricing builds trust, especially when tax treatment differs between destinations. However, the cheapest configuration may create higher maintenance costs later. That weakness deserves attention. Affordability should be tested through total cost of ownership, regional evidence, and customer feedback, rather than optimistic assumptions. This approach helps global buyers choose dependable solutions without sacrificing compliance, performance, or long-term value.
How to Keep Solutions Affordable for Global Buyers?

Defining Affordability for Global Buyers

Affordability for global buyers is not the lowest invoice price. It is the cost a customer can reasonably carry from purchase through daily use.

A solution priced at $100 may become $145 after freight, duties, local taxes, installation, and currency changes. That difference can break a carefully planned budget.

Real affordability starts with a clear landed-cost view.

Buyers need more than a headline figure. They need payment timing, warranty coverage, replacement intervals, training needs, and expected energy use. Small details matter.

In cross-border projects, affordability can be assessed through three questions:

Can the buyer pay now?
Can the buyer operate the solution later?
Can the buyer recover if conditions change?

Flexible quantities, transparent quotations, local documentation, and repairable components can reduce pressure without lowering quality. Yet affordability is not identical across markets. A monthly fee comfortable in one country may be excessive in another. Exchange rates, wages, import procedures, and technical support access alter the calculation.

We should also admit uncertainty. Forecasts can fail. Shipping delays happen. A responsible proposal shows assumptions, risks, and alternative specifications. It avoids promising a universal “best price.”

The cheapest option may create higher maintenance costs or costly downtime. A common weakness is focusing too heavily on purchase price.

A better review includes a three-year cost estimate, tested usage data, and feedback from local users. It still will not predict everything. But it gives global buyers a fairer basis for decision-making.


Analyzing Regional Costs, Needs, and Purchasing Power

How to Keep Solutions Affordable for Global Buyers?

Regional affordability depends on more than currency conversion. The World Bank’s 2021 International Comparison Program found that low- and middle-income economies produced 53% of global GDP at purchasing power parity. However, their income levels and household budgets vary sharply. A solution priced for a wealthy capital may feel reasonable there, but unreachable in a smaller city. IMF projections also show continuing inflation differences across regions, making fixed prices risky.

Practical pricing should reflect local needs, usage patterns, taxes, delivery costs, and payment habits. A basic package can serve buyers with limited budgets, while advanced features remain optional. In my experience, removing unnecessary features often improves affordability more than simply cutting the price. Still, regional adaptation can become confusing. Customers may not understand why two markets receive different packages. Clear explanations matter.

Tips: Compare prices against local purchasing power, not exchange rates alone. Use World Bank PPP indicators and IMF regional inflation data. Test pricing with small customer groups before scaling. Review prices quarterly, especially where currencies move quickly. Keep payment options flexible. A monthly plan may help cash flow, but it can cost more over time. That trade-off deserves honest wording. Companies should also measure affordability after taxes and delivery charges. Otherwise, the advertised price may look fair while the final checkout amount feels unreasonable.

Designing Scalable Solutions for Diverse Markets

Keeping solutions affordable for global buyers requires scalable design, not simple cost cutting. A scalable solution separates essential functions from optional features. Customers can begin with a basic package, then expand when demand grows. This approach reduces upfront risk for smaller businesses.

Local conditions must shape the design. The ITU’s Facts and Figures 2023 reported that 2.6 billion people remained offline. That gap reflects more than connectivity. It also involves device prices, data costs, language, and digital confidence. Solutions should support low-bandwidth use, offline workflows, clear instructions, and lightweight interfaces. Small interfaces matter. In field testing, these details often decide whether a product feels practical or frustrating.

Payment flexibility is equally important. The GSMA Mobile Economy 2024 report estimated 4.6 billion mobile internet users in 2023, yet access quality remains uneven. A single global pricing model may exclude entire customer groups. Regional packaging, transparent fees, and usage-based plans can improve access without weakening service quality. However, localization can become expensive when every market receives a separate system. Modular architecture helps control that cost. Shared core components can serve many regions, while local teams adjust language, compliance settings, and support channels. This balance is difficult. Some early assumptions will be wrong. Teams should measure adoption, support requests, and abandoned purchases, then revise the design instead of defending the original plan.

How to Keep Solutions Affordable for Global Buyers?

Designing scalable solutions for diverse markets

The chart shows the World Bank’s 2025 international poverty lines, expressed in 2021 purchasing-power-parity dollars per person per day. These benchmarks can support market segmentation, tiered pricing, and lightweight product design for buyers with different purchasing power.

Source: World Bank, International Poverty Lines, 2025 update.

Reducing Production, Delivery, and Service Expenses

How to Keep Solutions Affordable for Global Buyers?

Reducing Production, Delivery, and Service Expenses

Affordable solutions begin with a clear view of the total landed cost. Production teams should review materials, labor time, packaging, and quality checks together. A cheaper component may create more defects or increase installation time. That saving can disappear quickly. Standardizing selected parts often reduces purchasing complexity without weakening performance. However, excessive standardization can limit useful customization for different markets. A careful balance matters.

Delivery expenses require practical planning, not optimistic estimates. Compact packaging can reduce volume charges and protect products during long-distance transport. Regional assembly may also shorten delivery routes and lower warehouse requirements. Shipping data should be reviewed by destination, season, and order size. One average freight rate is rarely reliable. Small test shipments can reveal damage risks, customs delays, and unexpected handling fees before larger orders move.

Service costs influence affordability long after delivery. Clear installation guides, remote training, and replaceable modules can reduce support visits. Local service partners may improve response times, but their skills need regular assessment. A simple ticket system helps identify repeated failures and expensive misunderstandings. Our first cost models often underestimated support labor. That mistake deserves attention. Buyers value low ownership costs, yet they also need honest limits, transparent warranty terms, and realistic maintenance schedules.

Balancing Quality, Compliance, and Long-Term Value

How to Keep Solutions Affordable for Global Buyers?

Balancing Quality, Compliance, and Long-Term Value

Affordable solutions should reduce total ownership cost, not only the purchase price. A cheaper component can create more inspections, returns, and downtime. The World Bank’s 2023 Logistics Performance Index shows that customs efficiency and shipment reliability strongly affect supply-chain performance. These details matter when buyers operate across several markets.

Compliance also protects long-term value. Clear material records, test results, origin details, and traceable production batches help buyers prepare for audits. UNCTAD reports that over 80% of global merchandise trade by volume moves by sea. Therefore, packaging strength and documentation quality are practical cost controls, not administrative extras. In my experience, suppliers often improve specifications too early. That can raise prices without improving real performance. A better approach compares required standards, failure risks, and local operating conditions.

Tips: Define essential performance levels before discussing price. Use sample testing in realistic conditions, including heat, moisture, vibration, or heavy handling. Request a transparent cost breakdown for materials, inspections, packaging, transport, and replacement support. Keep compliance documents organized by product batch and destination market. Review warranty claims quarterly. Small records prevent expensive confusion later.

Long-term value needs honest measurement. Track defect rates, delivery delays, energy use, and service responsiveness. The calculation may feel imperfect at first. Still, visible evidence supports better purchasing decisions than assumptions.

How to Keep Solutions Affordable for Global Buyers? - Balancing Quality, Compliance, and Long-Term Value

A practical framework for evaluating purchase price, landed cost, regulatory readiness, and total cost of ownership
Evaluation Dimension Key Data Point Recommended Reference or Calculation Affordability Impact Practical Buyer Consideration
Purchase Price Quoted unit price before delivery, duties, taxes, and local charges Compare at least three equivalent specifications and normalize currency, quantity, and payment terms Low purchase price can conceal higher logistics or maintenance costs Confirm that materials, dimensions, performance ratings, packaging, and included accessories are identical before comparing prices
Landed Cost Final cost delivered to the buyer’s location Landed cost = product price + freight + insurance + customs duty + brokerage + local handling fees Often provides a more accurate comparison than the factory quotation alone Customs duty depends on the destination country, product classification, customs value, and applicable trade rules
Customs Classification Harmonized System classification used for import procedures Validate the applicable HS code with the destination customs authority or a qualified customs broker Incorrect classification may cause duty reassessment, delays, penalties, or additional clearance costs The first six HS-code digits are internationally standardized, while national tariff subdivisions may differ
Freight Efficiency Shipping cost per unit or per cubic meter Freight efficiency = total transport cost ÷ shipped quantity or usable cargo volume Better carton utilization and consolidated shipments can reduce the logistics cost allocated to each unit Compare carton dimensions, gross weight, pallet quantity, shipping mode, and delivery frequency
Quality Control Defect rate, inspection results, and corrective-action performance Track incoming defect percentage, rework rate, return rate, and closure time for corrective actions Preventive inspection generally costs less than repeated returns, emergency replacement, or production interruption Use written acceptance criteria, approved samples, inspection records, and traceable batch information
Quality Management Process control and consistency across production batches ISO 9001 is a quality-management-system standard; it does not prescribe a universal product defect rate Consistent processes reduce variation, waste, rework, and unplanned service costs Request evidence of process controls, calibration, supplier management, nonconformance handling, and internal audits
Regulatory Compliance Product-specific legal and technical requirements in the destination market Check applicable safety, electromagnetic compatibility, chemical, environmental, labeling, and documentation rules Compliance gaps can result in testing delays, product redesign, blocked shipments, or market withdrawal Requirements vary by product category and destination; conformity documents should match the exact model and configuration
Documentation Readiness Completeness and accuracy of shipping and compliance documents Typical documents may include commercial invoice, packing list, transport document, certificate of origin, test reports, and safety data information where applicable Complete documents reduce customs queries, storage charges, and clearance delays Ensure product descriptions, quantities, values, country of origin, and model references are consistent across all documents
Delivery Reliability On-time delivery rate and lead-time stability On-time delivery rate = shipments delivered on or before the agreed date ÷ total shipments × 100% Stable lead times reduce safety-stock requirements and the risk of expedited freight Evaluate production lead time, transit time, customs clearance time, seasonal capacity, and contingency planning separately
Trade Terms Allocation of transportation, insurance, customs, and delivery responsibilities Incoterms® 2020 contains 11 standardized trade terms; the selected term should be stated with the named place A lower quoted price may transfer freight, insurance, import, or delivery responsibilities to the buyer Compare quotations using the same Incoterm, named location, currency, shipment size, and delivery scope
Warranty Coverage Warranty duration, covered failures, exclusions, and response process Measure warranty cost by expected claims, replacement parts, labor, freight, and downtime—not by duration alone Clear coverage can reduce financial exposure when failures occur after installation Confirm claim deadlines, evidence requirements, replacement responsibility, return procedures, and remote support availability
Maintenance Cost Scheduled service, consumables, spare parts, and technical labor Annual maintenance cost per unit = planned service + consumables + spare parts + labor A slightly higher purchase price may be more affordable if maintenance frequency and parts consumption are lower Ask for service intervals, recommended spare-parts lists, expected component life, and maintenance instructions
Total Cost of Ownership Full economic cost throughout the expected service life TCO = acquisition + logistics + installation + energy + maintenance + downtime − residual value TCO prevents decisions based only on the initial quotation Use the same evaluation period, operating conditions, currency basis, and assumptions for every option
Energy or Resource Use Electricity, water, fuel, material consumption, or other operating inputs Operating cost = resource consumption per period × local resource price Lower consumption can offset a higher upfront cost over the service life Use measured or rated consumption data and test it under the buyer’s actual operating conditions
Currency Exposure Difference between quotation currency and buyer’s operating currency Model at least the agreed exchange rate, a downside scenario, and the payment-date exposure Exchange-rate movement can change the effective landed cost even when the supplier price remains unchanged Consider fixed-price validity, staged payments, currency matching, and the time between order and settlement
End-of-Life Value Repairability, recyclability, resale potential, and disposal obligations Net lifecycle cost = TCO − recoverable resale, reuse, recycling, or material value Designs that remain serviceable or recyclable can reduce replacement and disposal expenses Check spare-parts availability, upgrade options, material information, and local disposal requirements
Planning note: Actual duties, taxes, certification requirements, freight rates, warranty costs, and operating expenses vary by product category, shipment profile, destination market, and contract terms. Use destination-specific customs and regulatory information when preparing a final quotation.